Evaluation protocols (APP, NPP, UPP)#
A single test set cannot tell you whether a quantifier is robust to prior
shift, because it has only one prevalence. Protocols solve this by carving
many evaluation samples — each with a controlled class distribution — out of one
dataset. mlquantify ships three:
APP— Artificial Prevalence Protocol: prevalences laid out on a regular grid (exhaustive, the classic choice).UPP— Uniform Prevalence Protocol: prevalences drawn uniformly from the probability simplex (scales to multiclass without a grid blow-up).NPP— Natural Prevalence Protocol: plain random sampling, preserving the dataset’s natural prevalence.
The plot below draws the actual positive-class prevalence of every sample each protocol generates, so you can see the distribution each one explores.
import numpy as np
import matplotlib.pyplot as plt
from sklearn.datasets import make_classification

from mlquantify.model_selection import APP, NPP, UPP

X, y = make_classification(
    n_samples=4000, n_features=10, weights=[0.6, 0.4], random_state=0,
)

protocols = {
    "APP (grid)": APP(batch_size=200, n_prevalences=21, repeats=3,
                      random_state=0),
    "UPP (uniform simplex)": UPP(batch_size=200, n_prevalences=60,
                                 repeats=1, random_state=0),
    "NPP (natural)": NPP(batch_size=200, n_samples=60, random_state=0),
}

fig, axes = plt.subplots(3, 1, figsize=(7, 6), sharex=True)
for (name, proto), ax, color in zip(
    protocols.items(), axes, ["#264653", "#2a9d8f", "#e76f51"],
):
    prevs = [y[idx].mean() for idx in proto.split(X, y)]
    ax.hist(prevs, bins=np.linspace(0, 1, 26), color=color, alpha=0.85)
    ax.set_ylabel("count")
    ax.set_title(f"{name}  —  {len(prevs)} samples", fontsize="medium")
axes[-1].set_xlabel("Positive-class prevalence of the generated sample")
fig.tight_layout()
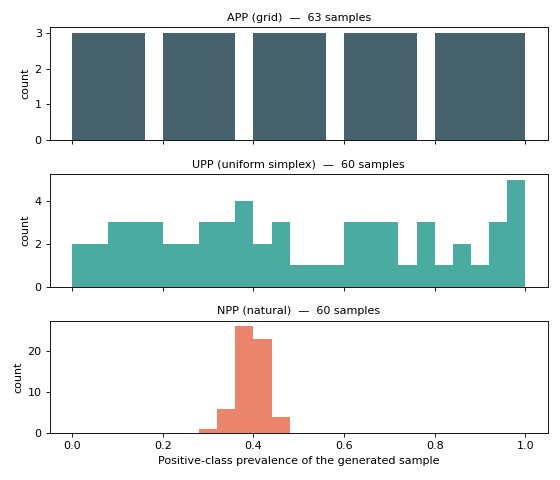
APP covers the range evenly (great for stress-testing a quantifier everywhere), UPP spreads samples randomly but still across the whole range, while NPP clusters tightly around the dataset’s natural 0.4 — realistic, but blind to shift. Use APP/UPP to evaluate robustness and NPP to estimate deployment error when the test distribution is expected to match the data at hand.
See also
apply_protocol— run a protocol and collect true/predicted prevalences in one call.Robustness to prior-probability shift — turn an APP run into a robustness curve.