Tuning a quantifier with GridSearchQ#
Hyper-parameters should be selected to minimise quantification error, not
classification error — and they should be evaluated across a range of
prevalences, not on a single validation split.
GridSearchQ does both: it scores every
candidate with an evaluation protocol and a quantification metric, then refits
the best one.
This example tunes the bandwidth of a KDEyML
quantifier. We let GridSearchQ pick the winner, then draw the validation
error across the whole grid to show why that value won.
import numpy as np
import matplotlib.pyplot as plt
from sklearn.datasets import make_classification
from sklearn.linear_model import LogisticRegression
from sklearn.model_selection import train_test_split

from mlquantify.matching import KDEyML
from mlquantify.metrics import MAE
from mlquantify.model_selection import GridSearchQ, apply_protocol

X, y = make_classification(
    n_samples=3000, n_features=20, weights=[0.5, 0.5], random_state=0,
)
X_tr, X_val, y_tr, y_val = train_test_split(
    X, y, test_size=0.5, stratify=y, random_state=0,
)

bandwidths = [0.02, 0.05, 0.08, 0.1, 0.15, 0.2, 0.3, 0.5]

search = GridSearchQ(
    quantifier=KDEyML(LogisticRegression(max_iter=1000)),
    param_grid={"bandwidth": bandwidths},
    protocol="app", samples_sizes=100, n_repetitions=5,
    scoring=MAE, random_seed=0,
).fit(X_tr, y_tr)

# Re-trace the validation-error curve the search optimised over.
scores = []
for bw in bandwidths:
    q = KDEyML(LogisticRegression(max_iter=1000), bandwidth=bw).fit(X_tr, y_tr)
    res = apply_protocol(
        q, X_val, y_val, protocol="app",
        n_prevalences=11, repeats=3, batch_size=100, random_state=0,
    )
    scores.append(MAE(res["true_prevalences"], res["predicted_prevalences"]))

best_bw = search.best_params_["bandwidth"]
fig, ax = plt.subplots(figsize=(7, 4.5))
ax.plot(bandwidths, scores, "o-", color="#264653")
ax.axvline(best_bw, color="#e63946", ls="--",
           label=f"GridSearchQ pick: bandwidth={best_bw}")
ax.set_xlabel("KDEyML bandwidth")
ax.set_ylabel("Validation MAE (APP)")
ax.set_title("Quantification-aware hyper-parameter selection")
ax.legend()
fig.tight_layout()
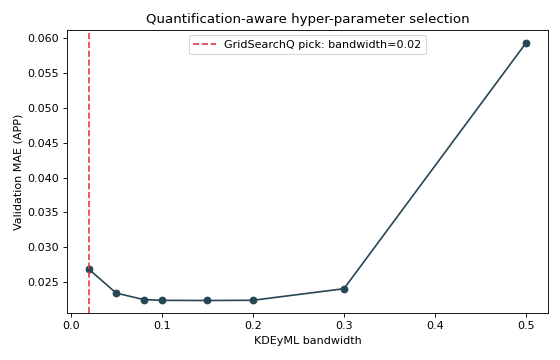
The curve is U-shaped: a too-small bandwidth spikes each class density on its
training points, a too-large one blurs the classes together, and
GridSearchQ lands on the bandwidth at the bottom. After fitting,
search.predict(X) uses the refit best model directly, and
search.best_params_ / search.best_score_ report the choice.
See also
GridSearchQ— protocol, scoring and parallelism options.Evaluation protocols (APP, NPP, UPP) — the protocols the search can drive.