Robustness to prior-probability shift#
The diagonal plot in Comparing quantifiers with diagonal plots shows where a quantifier errs; this example collapses that into a single, comparable curve: quantification error as a function of the amount of prior-probability shift between the test sample and the training set. A flat, low curve is the goal — it means the method is insensitive to how far the test prevalence has drifted.
We use ErrorByShiftDisplay, which bins the
protocol samples by their shift and draws the mean error with a ±std band.
import numpy as np
import matplotlib.pyplot as plt
from sklearn.datasets import make_classification
from sklearn.linear_model import LogisticRegression

from mlquantify.counting import CC, ACC
from mlquantify.likelihood import EMQ
from mlquantify.model_selection import apply_protocol
from mlquantify.visualization import ErrorByShiftDisplay

X, y = make_classification(
    n_samples=4000, n_features=20, weights=[0.5, 0.5], random_state=0,
)
_, counts = np.unique(y, return_counts=True)
train_prevalence = counts / counts.sum()

methods = {
    "CC": (CC(LogisticRegression(max_iter=1000)), "#e76f51"),
    "ACC": (ACC(LogisticRegression(max_iter=1000)), "#2a9d8f"),
    "EMQ": (EMQ(LogisticRegression(max_iter=1000)), "#264653"),
}

fig, ax = plt.subplots(figsize=(7, 4.5))
for name, (q, color) in methods.items():
    results = apply_protocol(
        q, X, y, protocol="upp",
        n_prevalences=300, batch_size=100, random_state=0,
    )
    ErrorByShiftDisplay.from_predictions(
        results["true_prevalences"], results["predicted_prevalences"],
        train_prevalence=train_prevalence, error_metric="ae",
        n_bins=10, name=name, ax=ax, color=color,
    )
ax.set_title("Absolute error vs. prior-probability shift")
fig.tight_layout()
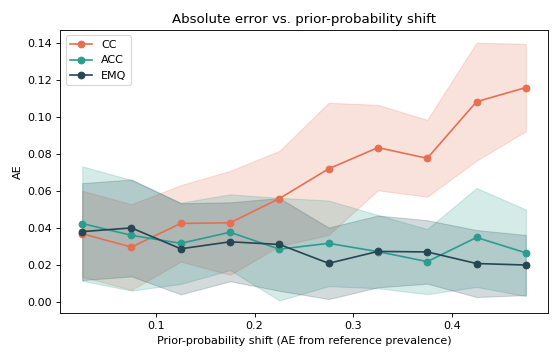
CC’s error grows steadily as the shift increases — exactly the bias from Why counting fails under prior shift, now quantified — while ACC and EMQ stay low and flat across the whole range. This is the plot to reach for when you need to defend a method choice: it summarises hundreds of test samples into one honest picture of robustness.
See also
Comparing quantifiers with diagonal plots — the per-sample scatter behind these curves.
ErrorByShiftDisplay— options and metrics.