Calibrating classifier posteriors#
Probabilistic quantifiers such as EMQ assume the
classifier’s posterior probabilities are well calibrated — that among the
samples it predicts with 70% confidence, about 70% really are positive. Many
classifiers are not: Gaussian Naive Bayes, for instance, is famously
over-confident when features are correlated.
ClassifierCalibrator fixes this post hoc by
rescaling the logits on a held-out split. The example below fits a
deliberately over-confident Naive Bayes model, applies Bias-Corrected
Temperature Scaling ('bcts'), and compares the reliability diagram and the
confidence histogram before and after.
import numpy as np
import matplotlib.pyplot as plt
from sklearn.datasets import make_classification
from sklearn.naive_bayes import GaussianNB
from sklearn.model_selection import train_test_split
from sklearn.calibration import calibration_curve

from mlquantify.calibration import ClassifierCalibrator

# Gaussian Naive Bayes is over-confident when features are correlated,
# which makes it a good (mis)calibration demo.
X, y = make_classification(
    n_samples=9000, n_features=20, n_informative=6, n_redundant=10,
    random_state=0,
)
X_tr, X_rest, y_tr, y_rest = train_test_split(X, y, test_size=0.5, random_state=0)
X_cal, X_te, y_cal, y_te = train_test_split(X_rest, y_rest, test_size=0.5, random_state=0)

clf = GaussianNB().fit(X_tr, y_tr)
p_te = clf.predict_proba(X_te)

# Fit the calibrator on a held-out split, never on the training data.
cal = ClassifierCalibrator(method="bcts").fit(y_cal, clf.predict_proba(X_cal))
p_te_cal = cal.predict(p_te)

def ece(y_true, proba, n_bins=10):
    """Expected Calibration Error of the top-class predictions."""
    conf = proba.max(axis=1)
    correct = (proba.argmax(axis=1) == y_true).astype(float)
    bins = np.linspace(0.0, 1.0, n_bins + 1)
    score = 0.0
    for lo, hi in zip(bins[:-1], bins[1:]):
        m = (conf > lo) & (conf <= hi)
        if m.any():
            score += m.mean() * abs(correct[m].mean() - conf[m].mean())
    return score

raw, fixed = "#e76f51", "#2a9d8f"
fig, axes = plt.subplots(1, 2, figsize=(11, 4.5))

# Reliability diagram (positive class).
ax = axes[0]
ax.plot([0, 1], [0, 1], "k--", lw=1, label="perfectly calibrated")
for proba, name, color in [
    (p_te, f"GaussianNB  (ECE={ece(y_te, p_te):.3f})", raw),
    (p_te_cal, f"+ BCTS  (ECE={ece(y_te, p_te_cal):.3f})", fixed),
]:
    frac_pos, mean_pred = calibration_curve(
        y_te, proba[:, 1], n_bins=10, strategy="quantile"
    )
    ax.plot(mean_pred, frac_pos, "o-", color=color, label=name)
ax.set_xlabel("Mean predicted probability (positive class)")
ax.set_ylabel("Observed frequency")
ax.set_title("Reliability diagram")
ax.legend(loc="upper left", fontsize=9)

# Confidence histogram.
ax = axes[1]
ax.hist(p_te.max(axis=1), bins=20, range=(0.5, 1.0), alpha=0.6,
        color=raw, label="GaussianNB")
ax.hist(p_te_cal.max(axis=1), bins=20, range=(0.5, 1.0), alpha=0.6,
        color=fixed, label="+ BCTS")
ax.set_xlabel("Predicted confidence (top class)")
ax.set_ylabel("Count")
ax.set_title("BCTS softens over-confident scores")
ax.legend(loc="upper center", fontsize=9)

fig.suptitle("Post-hoc calibration with ClassifierCalibrator")
fig.tight_layout()
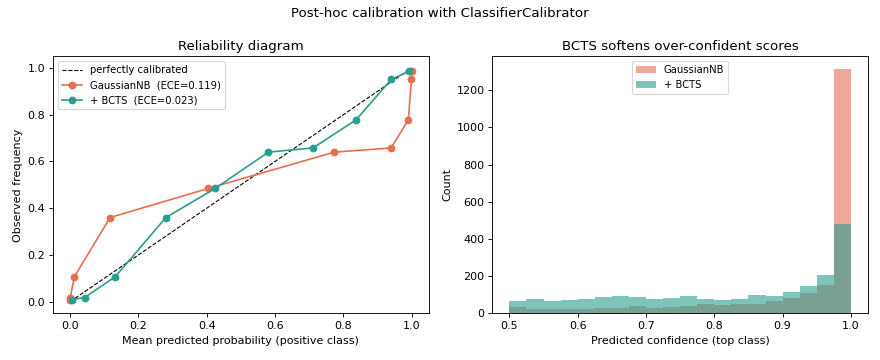
Naive Bayes pushes most of its predictions to the extremes: the orange
reliability curve sits well below the diagonal (it claims more confidence than it
earns), and its confidences pile up near 1.0. Bias-Corrected Temperature
Scaling, fit on the calibration split, pulls the curve back onto the diagonal and
spreads the confidences out — here it cuts the Expected Calibration Error roughly
five-fold. Because better-calibrated posteriors directly improve EMQ, passing
calib_function='bcts' to EMQ applies exactly
this step inside predict.
See also
Calibration — the Calibration user guide, with all four scaling methods (
'ts'/'bcts'/'vs'/'nbvs').ClassifierCalibrator— the API reference.EMQ and the EM prior correction — EMQ, the main consumer of calibrated posteriors.